Tyler Morgan-Wall | Building a ggplot2 rollercoaster: Creating amazing 3D data visualizations in R
videoimage: thumbnail.jpg
Transcript#
This transcript was generated automatically and may contain errors.
Hi everyone, my name is Tyler Morgan-Wall, I'm the developer of Rayshader and the Rayverse, and in the next 15 minutes, I'm going to tell you how you can turn your 3D data visualizations into a theme park ride entirely in R.
Now before we get started, I want you to think back to the very first theme park ride or rollercoaster you ever went on. I for one very clearly remember my first rollercoaster ride because I was 7 and it was a disaster. It was a bumpy, rough wooden coaster that bruised my ribs and rattled my spine, and every hill, turn, and bump is still ingrained in my mind. Now I don't have many memories from when I was 7, but that is one of them.
Now I want you to try to think back to the first data visualization you ever made. It was probably something like this, this, or god forbid, this. But you probably don't remember the first data visualization you ever put together. And that's because we tend to remember things in our lives that elicit an emotional response. My first rollercoaster ride stuck with me because of the emotions it evoked, even if they were negative.
Now you might be thinking, well, data visualizations aren't supposed to evoke emotion, they're supposed to be about informing the reader. And to that, I like to make an analogy to another type of institution that needs to balance fun and interesting with informative and educational, museums.
I like to look at building a data visualization like a museum curating an exhibit. Museums can have a bunch of self-contained exhibits that are static, small in scope, and designed so that viewers can digest the information at their own pace, much like most data visualizations. But that doesn't mean museums can't also build a giant IMAX theater or include a virtual reality thrill ride, something that will evoke a feeling of excitement in patrons long after the information from the placards has faded from their memory.
And this isn't just conjecture. Numerous studies have shown that the most vivid memories tend to be of emotional events, which are recalled with more clarity and detail than neutral events. So while not every exhibit should be a thrill ride, that doesn't mean none can be.
So while not every exhibit should be a thrill ride, that doesn't mean none can be.
I'm going to show you how you can make experiences out of your data visualizations. How you can turn a ggplot2 into a heart-pounding ride. Now it doesn't necessarily have to be a fast-moving roller coaster like this. Yours might be more It's a Small World than Space Mountain. I want you to have this tool in your skill set, and I'm going to show you how you don't need any fancy 3D modeling skills or Pixar-level animation skills to make fun 3D rides.
What you'll learn
So here's what you'll learn in the next 12 minutes. How to make a 3D roller coaster in R. But also why you might want to. But first, I'm going to go over some basic ways to make 3D plots in R that don't require any fancy skills, and I'll go over what makes a good 3D data viz. And finally, the most common feedback I get when I give a talk on 3D data visualization is, wow, I wish I could make something like that, but I don't work with any 3D data. So throughout this presentation, I'm going to give a bunch of examples of 3D data visualizations made from a variety of different data sets all in R that will hopefully give you some inspiration to try and make something of your own.
The Rayverse packages
Now there are a few packages out there for 3D data visualization, but I'm going to talk about the Ravers, the set of packages I developed that focuses on making high-quality 3D renders with realistic lighting. The main package I'll be using in this process is ray render, a package that enables you to make beautiful path trace 3D visualizations entirely in R. The ray shader package will be used to transform your data into 3D models using either geospatial data or the incredibly simple 3D ggplot2 interface. And finally, I wrote the ray rollercoaster package specifically for this talk. It automates the entire rollercoaster construction process down to two functions, one to interactively build your coaster and another to animate it.
What data works in 3D
So let's cover the basics. What exactly goes into a 3D data visualization? First, what kind of data can be used in 3D plots? All you need for a 3D data is are data with at least three numeric components. Here we have European flight path data from the crowdsourced open sky network. Flight path data has latitude, longitude, and altitude, which intuitively correspond as to X, Y, and Z, and are here plotted as 3D paths.
This is a fairly straightforward and intuitive use of 3D, but you can also choose to use 3D aesthetics with 2D data. Much like you might choose a line chart over a bar chart purely for aesthetic reasons, you might also choose a 3D chart over its 2D counterpart because you can make it more interesting and visually appealing. This is a map of the submarine fiber optic cable network, and there's no actual 3D data present, just latitude and longitude data. The cables rise out of the earth where they start and fall back in where they land. You could easily plot this as simple 2D paths on a world map, but I think the floating cables, subtle shadows, and rotating globe really elevate what is otherwise a fairly simple data set into something more relatable and tangible on a human scale, like the earth is being wrapped in yarn.
So many 2D plots have direct 3D equivalents, but just replacing points and lines with spheres and cylinders can lead to mixed results. Data floating in the void can be hard to interpret if we're just presented with a static image, as objects in the foreground can block those in the background, as we see here in this rendering of a morphine molecule generated with the ray molecule package. But you can solve this problem by animating the 3D data. The movement disambiguates the foreground from the background so that the reader can fully interpret the 3D model.
3D meshes and ggplot2 conversion
Besides points and lines, the other main type of 3D data visualization is the 3D mesh, a continuous grid of data values. This is where the ray shader package comes in. It takes 2D grids of raster data and creates 3D models by transforming the flat matrix data into 3D. So this visualization of the underwater volcano in Tonga that erupted earlier this year was generated from a simple 2D matrix of bathymetry values taken from a sonar survey. Check out the code to see how straightforward this is, from R matrix to 3D model in just a few function calls.
If you're having trouble conceptualizing what type of data can be used for a 3D mesh, one rule of thumb is that any type of data that can be mapped to the fill or color aesthetic in ggplot2 can also be mapped to 3D. Here we have a plot of infections in Jon Snow's famous cholera data set where the points are colored by the number of nearest neighbors for each infection. The process of converting ggplot2s to 3D is fully automated in RayShader's plot gg function. And if you want to learn more information, check out my RStudioConf 2020 talk on making 3D ggplot2s with RayShader.
3D vs color encoding
So one reason you might consider using 3D instead of color is that encoding data to color requires the viewer to reference a color bar to understand the ordering of the data. As there's no intuitive reason why some colors correspond to lower values and some colors correspond to higher. Here I plotted the heights of buildings in Seattle, Washington by mapping the data to color. Height, on the other hand, intuitively allows you to judge which values are less than or greater than others. You can tell when a building here is about half the height of another without having to reference an external color bar. However, because 3D introduces ambiguity in the depth axis, you lose precision. Thus 3D data visualizations are great when the exact numeric values aren't important but comparing relative values and getting an overall sense of the distribution of data is.
Using both 3D and color can give you the best of both worlds. Color to indicate precise numeric levels and height to give a more intuitive way to compare values. Here we have a visualization I made of the global population density using both color and height. The use of color allows the viewer to map data to direct population intervals while the use of height establishes order without needing to reference a legend.
Lighting and animation
Now if you're the type of person like me that likes to obsess over the tiniest details of your data viz, good news, 3D brings an entirely new type of detail to obsess about, lighting. Move over adjusting ggplot2 margins. If you've ever talked to a photographer, you know the real secret to amazing photographs isn't necessarily having the best equipment but rather having adequate and well-designed lighting. If you only have a single light like we do here in this 3D historical map, this visualization is a bit spooky, like a swing light bulb in a haunted house. If we look at this visualization of the blooming California poppy fields, we see with multiple distant fill lights, we see the atmosphere has changed completely. Much less moody and much brighter.
Even easier than all of that is using an HDR image file for environment-based lighting, which we see here in this visualization of Monterey Bay, California. It lights the scene with a real-world image, which results in natural, realistic lighting like your scene was in that environment.
If your data changes over time, you can then also introduce animation to your data viz. Here I used a Microsoft connect to capture my movements and load them into R using the R mocap package. By extracting the individual time slices from the movement data and rendering each frame completely, I was able to combine all the frames into this animation using the AV package. So watch out, Pixar, R users are coming for you.
So here I've used R and RayRender to bring Microsoft Clippy back to life to help you debug your data analysis pipeline. Maybe an idea for Posit's next professional product?
And for the creatively inclined, you can also produce stunning generative art in 3D using RayRender. Here I've simulated and plotted the trajectory of a particle in a strange attractor, a type of differential equation that displays chaotic motion. I've lit the scene with both a white and red light and changed the material of the object to give it a glossy sheen. We can also generate fractal trees using the ray bonsai package. This is a rewrite of Daniel Navarro's flame tree package to work in 3D and you can create all different types of trees, two or three lines of code, all generated in R with nothing but math.
Interactive camera and building the roller coaster
And finally, unlike in 2D where there's only one way to look at a visualization, in 3D you have an infinite number of camera angles, orientations and settings to choose from. It can be intimidating, especially if you've never worked in 3D before. But I've made it a little less daunting by including a fully interactive, real-time 3D to graphics device built into RayRender and working out of the box with no dependencies or no weird dependencies. You can fly around your scene with just your mouse and keyboard and find the best angle and print out your camera info for future use. This is all happening directly in your R session. You can even interactively save key frames and then generate an animation smoothly flying through your data visualization or as I'm about to show you, riding through it.
Now that you know everything you need to know to make a 3D data viz in R, let's build a roller coaster. First we need to generate a 3D scene for our roller coaster to travel through. Now this could be any of the visualizations I've shown up to this point, but I'm going to use a 3D ggplot2 because RayShader's 3D ggplot2 interface is by far the easiest way to make a slick 3D data viz in R. This is one function called passing the ggplot2 object and voila, a fully formed 3D data viz. You might note that I've turned off RayShader's ray tracing because we're going to get a much higher quality version of ray tracing when we render the scene with RayRender.
Now that we have our 3D scene set up, here's where the ray roller coaster package comes in. Here all we need to do is call the generate ray shader coaster function which extracts the ray shader scene for you and automates the entire roller coaster construction process. This function uses RayRender's built in interactive graphics device to let you fly around the scene and build a roller coaster directly in R. Here I've recorded a video of myself flying through the scene, pressing K at the key positions I want my roller coaster to travel through. When I'm done and close the window, it will generate a 3D model of a roller coaster that travels through those points.
Now I've extracted the full 3D scene here with get ray render scene and used render scene to get an overhead isometric view of the ride, sort of like roller coaster tycoon but with less death and destruction. Now that we're happy with our roller coaster, all that's left is simply calling animate roller coaster with a movie file name and we get our full first person animated roller coaster ride through our data set entirely in R.
360-degree VR experience
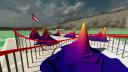
So we're all done creating our roller coaster. Or are we? You see, while this is cool, you might note that it's more ride than data viz. You can't look around because the field of view here is fixed at 120 degrees and the camera view is stuck along the track. If instead we set the field of view to 360 degrees, we can render the entire scene at every frame which gives us something that looks like this. So this is rendering a complete sphere surrounding the camera at every frame so that we can see every angle at once. This allows the viewer to choose where to look.
Now this animation looks rather funky and warped, but we aren't going to use the video in this form because you can do something very special with 360 degree videos. By injecting a little metadata to the MP4 file and uploading to YouTube, you can turn this video into a virtual reality 3D roller coaster and put yourself directly inside your data viz.
Now the viewer can look and direct their attention to wherever they want as they fly along the track. Because you control where you look, it truly feels like you're riding a thrill ride with exciting vertigo-inducing drops and dizzying turns that truly leaves an impression. You don't need any fancy VR gear to experience this. I made this video with just my phone and a $20 VR head mount and it only took a dozen or so lines of code to put together thanks to the power of R and the Ravers.
Because you control where you look, it truly feels like you're riding a thrill ride with exciting vertigo-inducing drops and dizzying turns that truly leaves an impression.
So in summary, 3D plotting is an awesome tool you should consider trying out and there's no better ecosystem out there for 3D data viz than R. Thanks to RayRender's interactive renderer and the Ray roller coaster package, building an impressive thrill ride through your 3D world is dead simple and only takes a few lines of code. And finally, consider combining the tools of virtual reality with 3D data viz to immerse your viewers on rides or tours throughout your data. By actually putting your viewers in the data visualization, you can form longer lasting connections to your work by evoking emotion and allowing the user to experience your visualization in a more up close and personal way. Thank you so much for your time and enjoy the ride.
