John Goldin | Apple Health Exports | Posit (2022)
videoimage: thumbnail.jpg
Transcript#
This transcript was generated automatically and may contain errors.
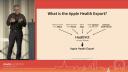
We were having a story, when last seen, I was back from the emergency room the following day and wondering what had happened to me. And like all of you here, hopefully all of you here, I have the power of R and RStudio and I know how to do an internet search. So I found a blog post that told me how to export all the data from the Apple health export. And that's what I did. And I also know ggplot. And I did this chart.
This is the very chart that I took with me to my doctor a couple days later. It's not a very fancy chart. The vertical axis shows my pulse, the horizontal axis is the time of day, zero is midnight. And you can see about, there is the event that sent me to the emergency room, my perception event that sent me to the emergency room. In the middle of the night, about 1.30 a.m., this is when I was upset, got up, took some bicarbonate of soda, the whole thing did not last very long, went back to bed, went to sleep. While I was asleep, my pulse was going up gradually, which is very unusual. And then hit that and off I went.
And that's the story of my visit to the emergency room, which was not a big deal. But it does provide an example of how your health tracker is basically making a recording of your life with data.
But it does provide an example of how your health tracker is basically making a recording of your life with data.
The Apple health export dataset
So in order to do this chart and to look into this a little bit more, I had to sort of dig into the Apple health export. And the first thing that sort of blew me away was just the sheer volume of data. Never in my professional life have I worked with a data set nearly as large as me. And I was kind of excited about that and it was kind of fun. So 3.9 million rows, 1.2 million rows in the last year alone. I mean, as we speak, I am adding rows to the data.
And I also did some additional stuff to try to say, was this night unusual? And went back and tried to look for other examples and didn't find anything, which was a good thing. So I have all this incredible amount of data, but you think of it as a recording of your life, but if you had an audio recording or a visual recording of your life, most of those moments wouldn't be very interesting. And the same is true of the data. There's a lot of data which is dull.
It's 70% of the data is this sort of low-level stuff, your heart rate, your active energy as you're moving around and so on. But there are a bunch of summary measures and other categories of measures. Basically, this is what you see on the health app on the iPhone, or you see sort of these icons with these categories of things that it's keeping track of. And underneath each of those, or with each of those, are set of individual measures. And this is the measure, the ones that would fit on the screen. There are quite a few more than this.
So let's talk about what is the Apple health export. So basically, on the iPhone, there is a database of all of this information. And that's what's sitting underneath the health app. And Apple, if you're an app developer on the iPhone, the API to that database is called the health kit. And what's happening is, is measurements are being fed in from the watch, are being fed in from the phone. They're also coming in from other apps. For example, I have Lose It on my phone, which is a calorie counting app, which I have occasionally used. I have a blood pressure cuff, which has a Bluetooth connection to my phone. I also have it set up so it has a connection to my electronic health record, so it's all of the records from my doctor. All of that goes into this database, and it becomes accessible via the export.
And when you actually ask for an export, in my case, it takes it about nine minutes before it can assemble this whole thing. And then I can export it to my laptop and load it into R. Now, when I unzip this export file on my laptop, I think it's like three and a half gigabytes, which again is sort of crazy. It's a very wordy format. There's basically one table that I care about. And that one is, before I process it in, that one is like one and a half gigabytes.
So it is a tidy table, this table. You don't even have to tidy it up. It's already a tidy table. It's got one row per measurement for my 3.9 measurements or whatever, 3.9 million, whatever it was. And each row has a start time stamp, an end time stamp, the type of what is being measured, the value, and the source of the measurement, the phone or my blood pressure cuff or whatever, and the version of the software that did that measurement.
So you'll focus on type and value usually, but you'd need to pay attention to the source and the version as well. The source, so for example, your step count is being produced by the watch, but the phone is also producing a step count. They both get fed in. If you don't pay attention to the source, you end up double counting, and I've had that happen with other measures as well.
Resting heart rate and software version changes
So let's look at a measure. This is resting heart rate. I'm interested in what's the trend in resting heart rate. We have on the vertical axis heart rate, on the horizontal axis, we have more than four years worth of data here, one point per day, and all of this feels very personal to me. So I look at a chart like this, and I look at this thing, and I look at the smooth line that I put through this chart, and I say, whoa, what's going on here? Why is this line doing this? Is there something about me? Should I be worried about this? This is a trap you can fall into by spending too much time with your own data.
Should I worry about this? Well, let's look at the version. So the vertical green bars show the major versions of the watch OS software, and you see that basically what's happening is between version six and version seven, they changed the measurement. So what happened with version seven, they added sleep tracking. So before version seven, when they were saying resting heart rate, what they were usually ending up with was my heart rate at three in the morning or when I was asleep, near the lowest heart rate of the day, and they basically redefined the measure, let's say improved the measure, so that it was only while you were awake.
You have to watch out for this thing with any data set. You definitely have to watch out for it with the Apple health export. Sometimes there are clues to things like this, but sometimes there are not. Sometimes it's a black box, and you've got to figure this out on your own.
VO2 max and the electrocardiogram
I'm going to show one more example because I like it a lot. This is a measure I'm very interested in, VO2 max. This is a measure of your aerobic fitness. When it's done directly, you're in a lab and they're measuring your exhaled gases and seeing how well you're using oxygen. Obviously you don't do that with an iPhone. So they have an algorithm that estimates your VO2 max based on while you're walking a certain distance, you're looking at your heart rate and the speed that you're traveling the distance. I look at this chart. I'm actually pretty good at inventing explanations for things that don't have explanations, but I look at this chart and I can't see anything, but if we add in the version numbers, we see that Apple is working on improving their measures, or I assume that's what's going on.
You see that between version five and version six, it goes up, then it goes back down. What's been happening more recently is less clear to me what's going on with versions. Maybe stuff is, maybe it isn't. I don't know. You just have to look at the data and see. I would love to know what my long-term trend is for this, to watch this over time, but I look at this and certainly for the earlier years, no, there's nothing I can do with that.
For all of these measures, you can dive in and get into stories like this. Let's get into one last measure, which is different than all the others, which is the electrocardiogram, which was added with the Apple Watch 4. This is different because it actually has FDA approval as an actual medical device, doing the electrocardiogram, and then also the software that evaluates whether it's showing signs of atrial fibrillation. Atrial fibrillation is a problem with the electrical signal in the upper chamber of the heart.
I should emphasize for this population that it's generally a problem among the elderly, not a problem for the age demographic that is typical of this conference. You actually do the electrocardiogram by putting your finger on the stem of the watch, as is shown in the picture here, and then to the right, we have an actual little example of the electrocardiogram strip that it produces. That strip is my strip, indicates atrial fibrillation. That was from October of 2020. That's the second time I had an episode of atrial fibrillation in seven years. I am elderly, so it's not so far-fetched.
Got into the news recently because John Fetterman, the Senate candidate in Pennsylvania, was in atrial fibrillation, and it contributed to his stroke. What do I do in a situation like this? Well, I do a ggplot. Again, when I had my episode of atrial fibrillation, I went to the emergency room. My doctor is not so surprised when I walk in with a ggplot.
In the case of atrial fibrillation, I literally use the same function that I had written several years before for the first plot. In this case, I have all the raw data from the atrial fibrillation episode, which actually starts about 1230. What happened during the day was I was having a normal day. I went out for exercise in the morning. My heart rate slightly elevated, all perfectly normal. Sit down for lunch. Partway through lunch, I felt funny, checked, and realized something is going on.
I have the raw data for the atrial fibrillation, but I don't have the expertise to do anything with that. That's just beyond me. What I was able to do was to take the background heart rate information and to put the atrial fibrillation episode in the context of the rest of the day. There is some slight relevance to when I was discussing this with the doctor. What I could show was that within a minute or two after the episode started, there's an indication there that shows I was doing the electrocardiogram. I could tell. This is evidence that I knew when I went into atrial fibrillation. Sometimes people don't know they're in atrial fibrillation, but I knew.
You can also see that I came out of it before they hooked me up to an electrocardiogram in the emergency room. It actually goes on and off like throwing a light switch. None of these things I'm showing you have dramatic effects on my medical treatment. In this particular case, there was some slight advantage in having a discussion about whether I needed to go in blood thinners and whatever.
The general point is that this stuff shows you a picture of your life. There's a lot of data there. If you have just looked at Palmer Penguins one too many times and you want to try something else with dplyr, you may have hundreds of thousands, millions of rows of data that you may find more interesting than Palmer Penguins. I've done a series of blog posts about this. If you have more interest in figuring out how to do this, there's a lot more information there. There's also a URL with an example of some other things that people have done with their data.